South Australian Medical Heritage Society Inc
Website for the Virtual Museum
Home
Coming meetings
Past meetings
About the Society
Main Galleries
Medicine
Surgery
Anaesthesia
X-rays
Hospitals,other organisations
Individuals of note
Small Galleries
Ethnic medicine
- Aboriginal
- Chinese
- Mediterran
Whole Body Plethysmographs
ACKNOWLEDGEMENTS
We are grateful to Prof. Alan Crockett for allowing us to use photographs of some of the plethysmographs from his lab, and providing further information; to Allen Gale for the BodyTest plethysmograph photograph, and to Dr Prue Cowled from the Basil Hetzel Institute for the toe photoplethysmograph photographs.
A plethysmograph is a device which measures the changes in the volume of an object. The most common uses are to calculate lung volume and airway resistance by the measurement of pressures and an application of Boyle's law. These metrics are useful in the diagnosis and management of various types of lung diseases, eg: asthma, COPD, and interstitial lung disease (asbestosis, fibrotic lung disease, etc).
The word "plethysmograph" is derived from the Greek plēthusmos ("enlargement") and graphein ("to write"), and was coined some time around 1870-75.
There are two main classes of body plethysmographs, the constant volume (DuBois), and the variable volume (Mead). Both types can be used to determine various lung volumes (functional residual capacity (FRC), aka ITGV (intra thoracic gas volume); maximum volume, tidal volume, etc), flow rates, the airway resistance, and to diagnose restrictive and obstructive diseases.
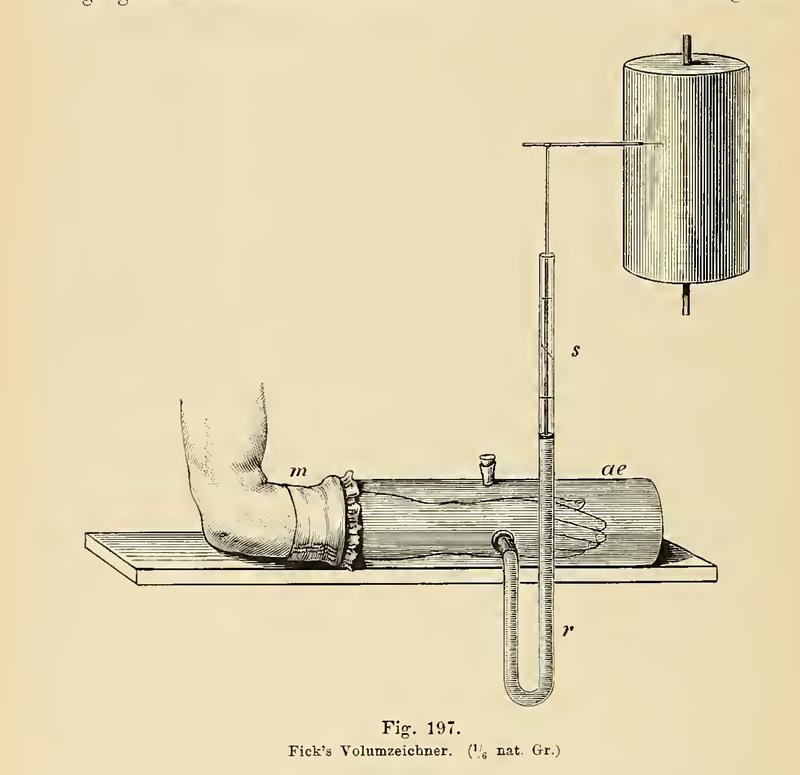
The picture above is an example of a plethysmograph recording the changes in volume of a forearm, taken from Physiologische Graphik: Ein leitfaden der in der physiologie gebräuchlichen registrirmethoden ("Physiological graphics: A guide to the methods of registration commonly used in physiology"), Dr. Oskar Langendorff, 1891, pg 236. The container is filled with water, as is the U-tube. As the arm changes in volume, the float in the tube rises and falls, and its height is recorded on a rotating drum.
One of the earliest recorded body plethysmographs was made by the Dutch biologist Jan Swammerdam in 1667. In an effort to prove his mistaken idea that the expanding chest pushed air into the lungs, Swammerdam placed a tube into the throat of a dog and then submerged it in a barrel of water. As the dog breathed in and out, the water level rose and fell.
A similar experiment was conducted by the Scot Dr. Robert Menzies, and described in his thesis "A dissertation on respiration" in 1790. He repeatedly blew into a bag of a known volume (2,400 cubic inches, or 39.33 L) until it was full (~56 breaths), averaging 42.8 cubic inches (701.4 mL) per breath.
He checked this by placing a person in a barrel of water up to their neck, and recorded the changing height of the water as they breathed. From this he could calculate the changes in volume as a result of breathing. He found that the bag method and water immersion method both yielded the results.
-
 An animal plethysmograph. From "Physiologische graphik", pg 268.
 -
 A sketch of a body plethysmograph used by J. S. Haldane and J. G. Priestley, from "The Journal of Physiology", Vol 23, Issue 3-4, 1905
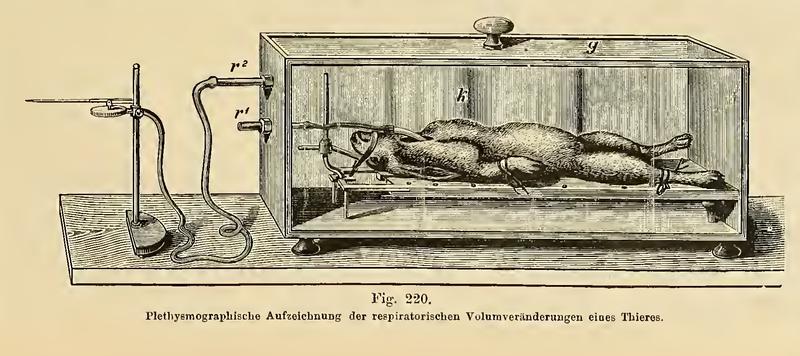
These two diagrams show examples of early body plethysmographs. The first picture is of a sealed box containing a rabbit. There is a short tube running from outside the box into the rabbits trachea, allowing it to breathe. The longer tube leads to an external pressure recorder, in this case a Marey-style recording needle, which would then scratch the recording onto a sheet of lamp black (carbon black) covered paper on a rotating drum (not shown in this picture), much like the phonautograph did with sound.
The other picture is of the type of plethysmograph used by J. S. Haldane and J. G. Priestley to record the amount of air breathed in their research into how CO2 levels affected breathing. The the lower tube allows for calibration and venting of the box, and the other tube leads to a pressure recorder.
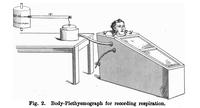
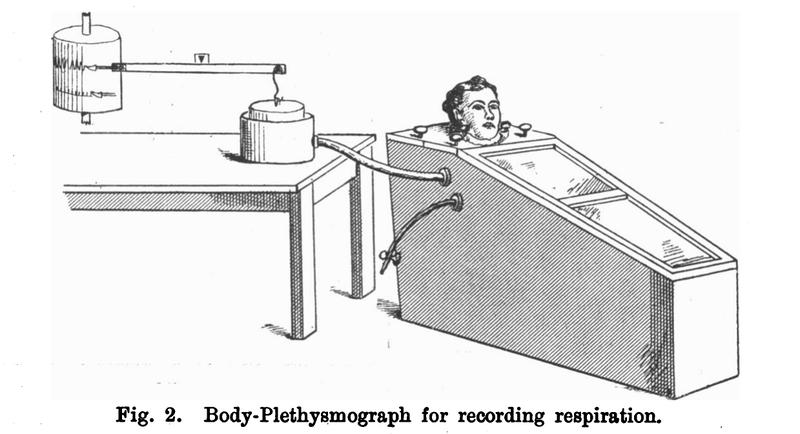
The picture above is a more recent example of a variable volume plethysmograph. This type of box was designed in 1960 by Dr Jere Mead, and is similar to the box used by Haldane and Priestley.
The subject breathed air from outside of the box. The resulting change in box volume was recorded by a spirometer or calculated from a pneumotachograph. The pressure at the mouth could be measured directly, and the amount of air breathed was recorded by a pneumotachograph.
From Journal of Clinical Investigations, vol 49, Issue 6 (June 1, 1970), pg 1238.
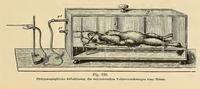
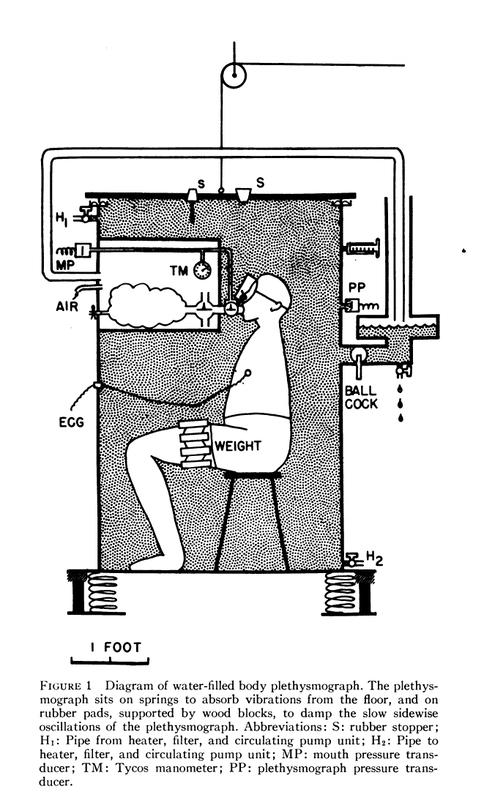
The picture above shows a schematic design of one of DuBois' early plethysmograph designs from the early 1950's. The person sat inside a large box filled with warm water, which would allow for easy monitoring of volume changes. It is reported that as the person entered or left the box, it flooded the Dean's office below. For some strange reason, this design did not last long.
In 1955, Dr Arthur DuBois, et al, described a new way to calculate the amount of air in a person. This method was based on Eduard Pfluger's 1882 idea of the voluntary compression and decompression of gas in the lungs. It was faster, easier to perform, and more accurate than the existing techniques.
-
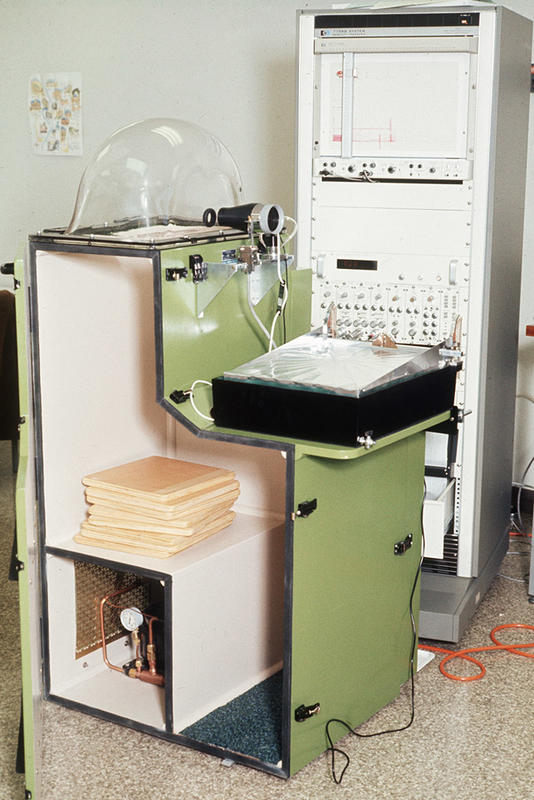
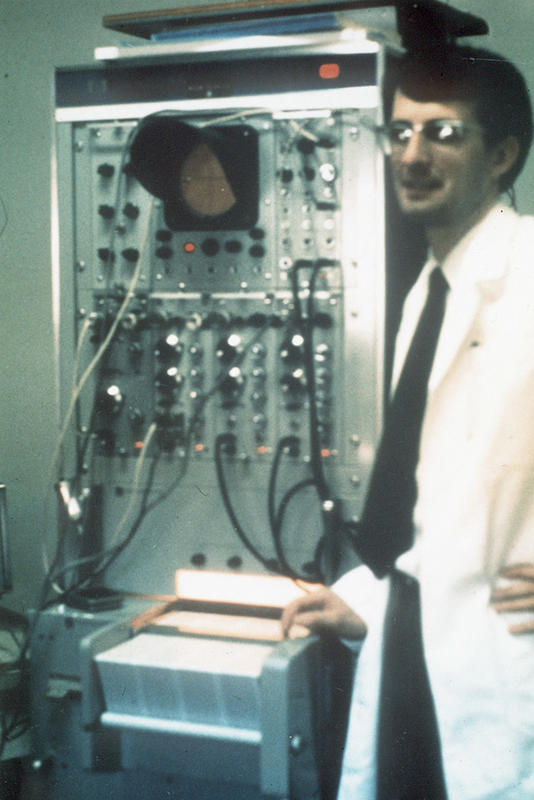
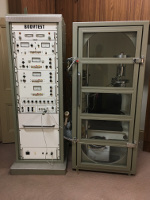 A Jäger BodyTest unit (left) with control machine (right). A DuBois type full body constant volume plethysmograph from c. 1978.
 -
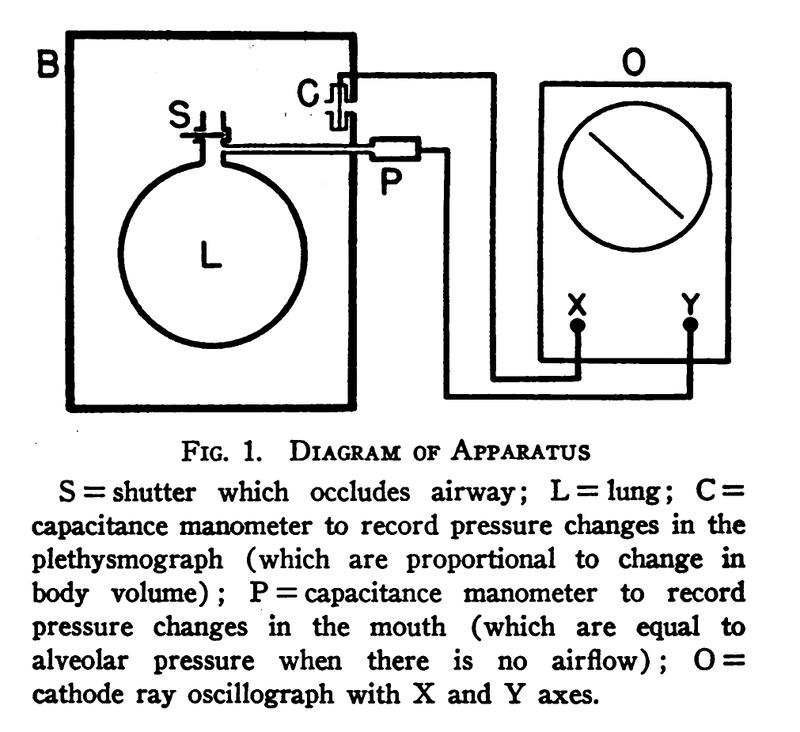
 A schematic of DuBois' plethysmograph and analyzer from around 1955.
From "Measurement Of Airway Resistance With The Body Plethysmograph", Allan Hemingway, pg 32. -
 A schematic of DuBois' plethysmographic setup.
From: The Journal of Clinical Investigation, vol 35, issue 3, pg 322-326.

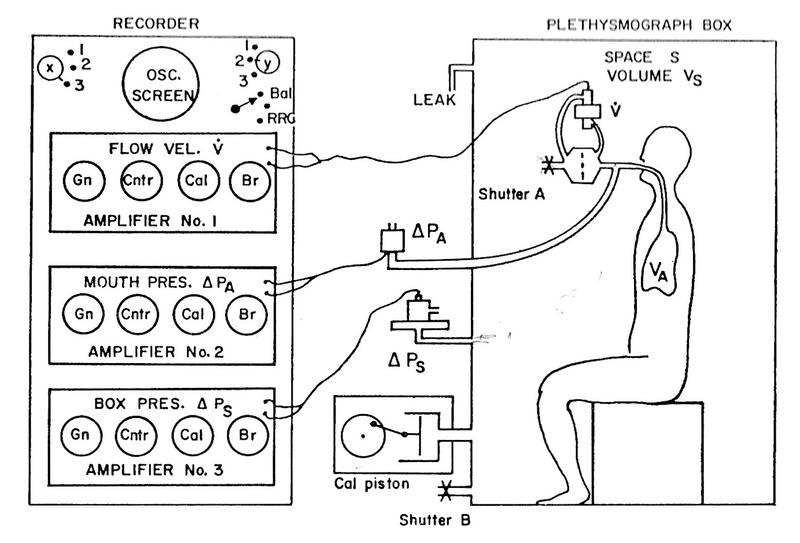
The oscilloscope was used to plot two variables. When plotting the box pressure versus the pressure at the mouth, the operator was able to calculate the volume of air in the subject. The shape formed by these traces during inhalation and exhalation could be used to discover if the patient had restrictive or obstructive diseases.
Alternatively, by plotting the change in mouth pressure versus the flow rate, one could determine the airway resistance from the slope of the trace.
The subject sat inside a sealed box of approximately 600L, roughly the size of a telephone booth, until the temperature inside had stabilized, and the pressure inside the box was adjusted to be equal to the external atmospheric pressure. The subject would then breathe through a mouthpiece that could be closed remotely. At the end of a normal exhalation (when the lungs volume is at the functional residual capacity, or FRC), a shutter inside the mouthpiece closed, and the subject would then rapidly try to breath in and out (~2Hz) a few times, then the shutter would be opened again. The pressure at the mouth (which is the approximately the lung pressure when breathing freely), and inside the box were recorded simultaneously. From this, and the volume of the box, one could find the volume of air in the subject using Boyle's law, which states that for a constant temperature, pressure times volume is constant.
So, if we call the thoracic pressure at the end of exhalation P1, which is the same as the box pressure (otherwise, they would still be exhaling), the it follow that the pressure at the end of the attempted inhalation of P2 = (P1 + ΔP), where ΔP is the difference in mouth pressure before and after. Similarly, the thoracic volumes are V1 after exhalation, and V2 = (V1 + ΔV) after inhalation.
P1V1 = P2V2
P1V1 = (P1 + ΔP)(V1 + ΔV)
P1V1 = P1V1 + P1ΔV + ΔPV1 + ΔPΔV
0 = P1ΔV + V1ΔP + ΔPΔV
-V1ΔP = P1ΔV + ΔPΔV
V1ΔP = -ΔV(P1 + ΔP)
V1 = -ΔV(P1 + ΔP) / ΔP
As ΔP is much less than the atmospheric pressure, this approaches:
V1 = -ΔVP1 / ΔP (eq 1)
Since negative volume makes no sense, we can write:
V1 = P1(ΔV / ΔP)
As we know that the pressure at the mouth (P1) is very nearly at atmospheric pressure (Kv), that in a closed system the change in lung volume must be the equal and opposite to the change in the box volume, and that V1 is the thoracic gas volume (also know as the Functional Reserve Capacity), we can rewrite eq. 1 as:
FRC = Kv(ΔVbox / ΔPmouth)
An increased FRC (relative to the normal for height) can be indicative of an obstructive disease such as asthma or emphysema, while a decreased FRC may indicate a reduced compliance (elasticity), and a restrictive disease.
The airway resistance can then be calculated from the difference in airway pressure and the flow rate of the air (the derivative of volume with respect to time):
R = ΔPmouth / (dV/dt)
One might note the similarity to Ohm's law, Resistance = Voltage / Current. As current (I) is the time derivative of charge (dQ/dt), and voltage is the difference in electric potential (ΔV) this can be written as R = ΔV / (dQ/dt).
The airway resistance could also be calculated graphically. By plotting the flow rate, dV/dt on the y-axis; and ΔP on the x-axis of an oscilloscope, the resistance equals:
R = Kp/Kf . xp / yf . cot(p)
where Kp and Kf are the gains of the pressure and volume inputs respectively, and cot(p) is the cotangent of the angle (p) of the line with respect to the x-axis.
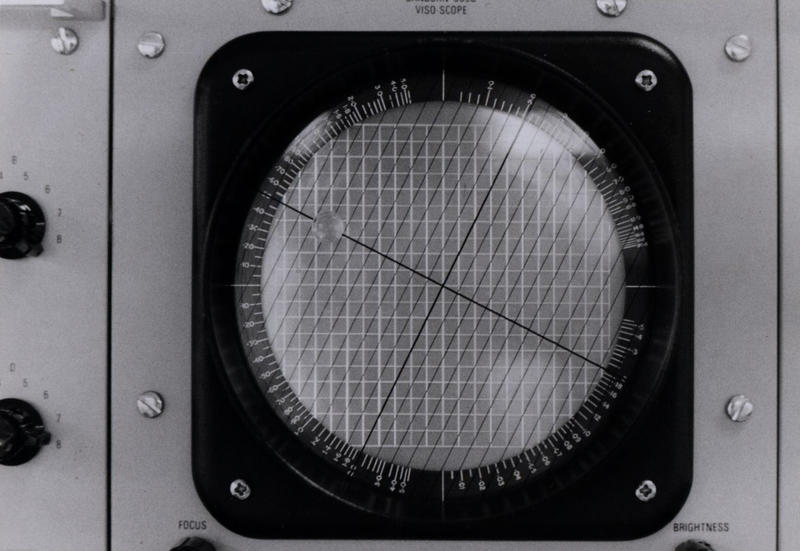
This could also be achieved by the use of a special bezel attached to the oscilloscope, such as the one designed by Prof Crockett, shown above. This allowed the operator to quickly and easily find the angle of the line.
Whole body plethysmographs are still commonly used to determine lung volumes and airway functions. Advances is computing have made them easier to use, and thus more useful.
Appendix
Another important use of plethysmography is in the measurement of the flow rate of blood, its oxygen saturation, blood circulation, and other variables. One cheap and non-invasive method of collecting these data is to use a photoplethysmograph, which as its name suggests, uses light to measure the changes.
-
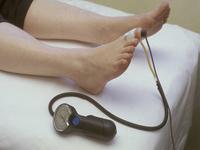 Toe blood pressure and photoplethysography.
 -
 A photoplethysmograph machine.
 -
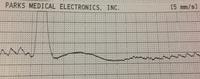 A photoplethysmograph of the blood flow in the big toe.
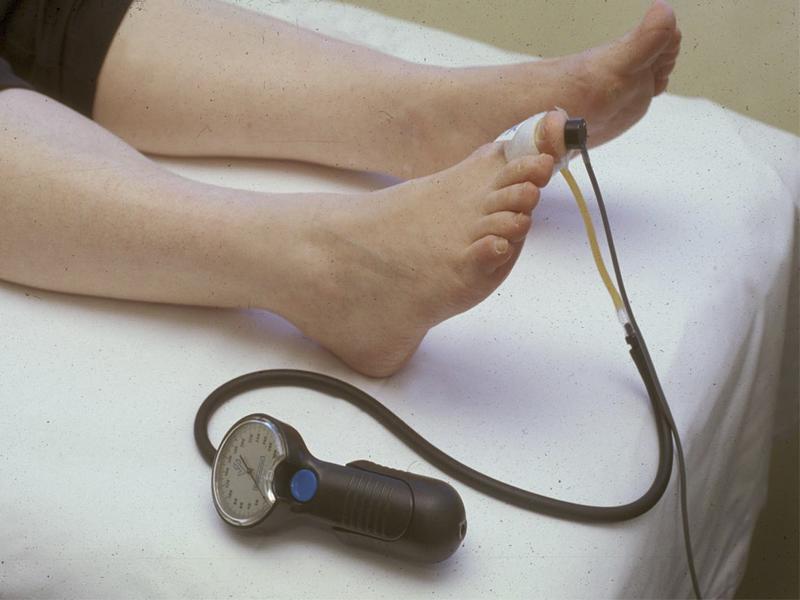
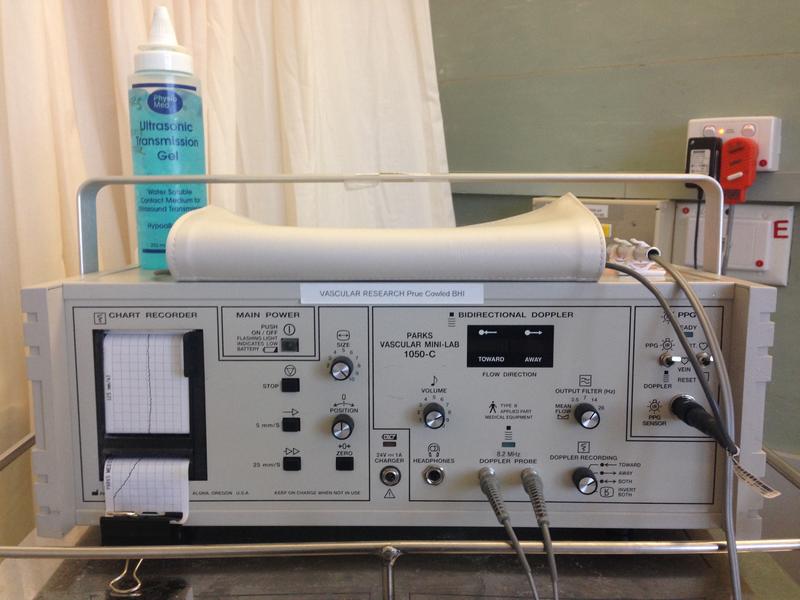
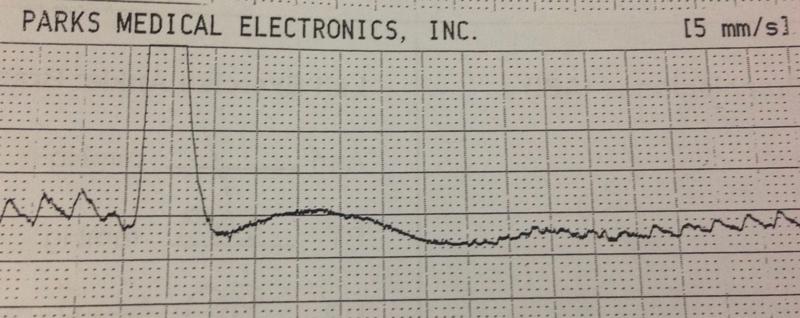
The first picture above shows a photoplethysmograph (often abreviated as PPG) and a small blood pressure cuff attached to a big toe. The PPG can be used in the auscultatory method of measuring blood pressure, replacing the stethoscope. A pressure of < 60 mmHg suggests that there may be a peripheral circulation problem. The photoplethysmograph in this picture is a pulse oximeter, which uses light to give non-invasive estimates of blood oxygenation and flow rates. These data can then be processed (by a machine like the one in the second photograph) to give information about the pulse (last picture). Over a longer period of time, variations in the blood pressure are generated by breathing and other factors, and these can be detected and estimated from the recordings. There is also some evidence (an article by Mohamed Elgendi has an analysis and references) to suggest it can be used to estimate vascular stiffness and other cardiovascular variables.